Upcoming changes to the way in which Continuums of Care (CoCs) report HMIS data to HUD each year will provide communities with new analysis tools. These tools will allow CoCs to develop a much more granular understanding of how homelessness is experienced in their jurisdiction and how their homeless systems operate, in addition to providing information for HUD’s Annual Homeless Assessment Report to Congress (AHAR). To reflect this broader purpose, AHAR reporting will be renamed Longitudinal Systems Analysis (LSA).
This blog is the third in a series on how communities can use HMIS data to support community planning to improve responses to homelessness. In this post, we introduce the first of the CoC Analysis Tools, a new resource to aid Continuums of Care in understanding what homelessness looks like in their community. For an introduction to system modeling, please see the first post in this series.
—
Stephanie Reinauer, Abt Associates
The CoC Racial Equity Analysis Tool, released by HUD earlier this week, allows communities to easily visualize the racial dimensions of poverty and homelessness experienced in their jurisdictions. With a better understanding of which racial and ethnic groups who are more likely to experience homelessness, communities can take steps to improve their homeless crisis response systems.
The recent release of the Supporting Partnerships for Anti-Racist Communities (SPARC) Phase One Study Findings by the Center for Social Intervention ignited a national conversation around racial and ethnic disparities in homelessness. Authors of the report found that nearly three-quarters of people who experienced homelessness in the communities analyzed were people of color, despite making up less than one-third of the general population.
While people of color are also more likely to be living below the poverty line, poverty alone does not account for increased the rates of homelessness. The causes of these disparities are complex and rooted in a long history of segregation and discriminatory practices in housing, banking, and criminal justice systems. Much of this troubling history is summarized in the SPARC report.
A local look at on racial and ethnic disparities
With the release of the CoC Racial Equity Analysis Tool, communities have a resource that will enable them to easily visualize the impacts of racial and ethnic inequality on homelessness at the local level. The charts and data tables in the tool display Point-In-Time (PIT) Count data that give a snapshot of homelessness on a given night alongside American Community Survey (ACS) data on poverty, making it easy to compare the distributions of people within a CoC service area who are in poverty and experiencing sheltered or unsheltered homelessness on a given night, by race and ethnicity.
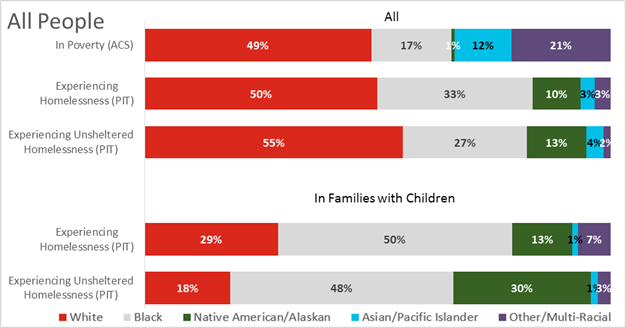
In data for the CoC pictured below as an example (Exhibit A), for example, black people (represented by the gray bars) account for 16 percent of people living in poverty locally but 29 percent of people experiencing homelessness – a pattern of overrepresentation that mirrors the national trends. Native America/Alaskan Native people (represented by green bars) make up a very small share of people in poverty but are also overrepresented among those experiencing homelessness. In contrast, the Asian/Pacific Islander population (blue bars) is under represented in the PIT data, making up only 4 percent of the homeless population as compared to 18 percent of the population living in poverty.
Exhibit A. CoC Racial Equity Analysis Tool Data – Example Community
These data provide a jumping off point from which communities can begin to explore why one or more racial groups make up a larger share of people experiencing homelessness than would be expected looking at the ACS poverty data. Communities may also want to look at the protective factors that support housing stability for some populations despite high rates of poverty.
What’s next?
This tool lays the groundwork for deeper analysis that will be available with the upcoming Longitudinal System Analysis (LSA), which will replace the Annual Homeless Assessment Report (AHAR) as the primary mechanism for reporting demographic and system use data to HUD. Communities will have access to more detailed information with the LSA that will aid in understanding how effectively communities of color are being served by the CoC. Future CoC Analysis tools will allow assessment of racial disparities for different household types and population groups in three core measures:
- The length of time people spend homeless and in the service system
- The number and share of people successfully exiting homelessness to permanent housing
- The degree to which households that are housed return to homelessness
To learn more
For more information on racial disparities in homelessness, see:
- Supporting Partnerships for Anti-Racist Communities (SPARC) Phase One Study Findings (Center for Social Intervention)
- Racial Disparities in Homelessness in the United States (National Alliance to End Homelessness)
- How to Start Addressing Racial Disparities in Your Community (U.S. Interagency Council on Homelessness)
- What Funders Are Saying About Racial Equity and Homelessness (Funders Together to End Homelessness)
January 2019